
Imagine putting six members of the same leadership team into separate rooms and asking them one question:
“What is the biggest problem holding this business back?”
The Sales Director says product development is too slow.
Engineering says Sales keeps changing the requirements.
Operations says forecasting is hopeless.
Finance says margins are disappearing because everyone keeps expediting everything.
The CEO thinks the organisation lacks accountability.
And the Commercial Director thinks Operations simply isn’t responsive enough.
Who is right?
Quite possibly, all of them.
And that’s the problem.
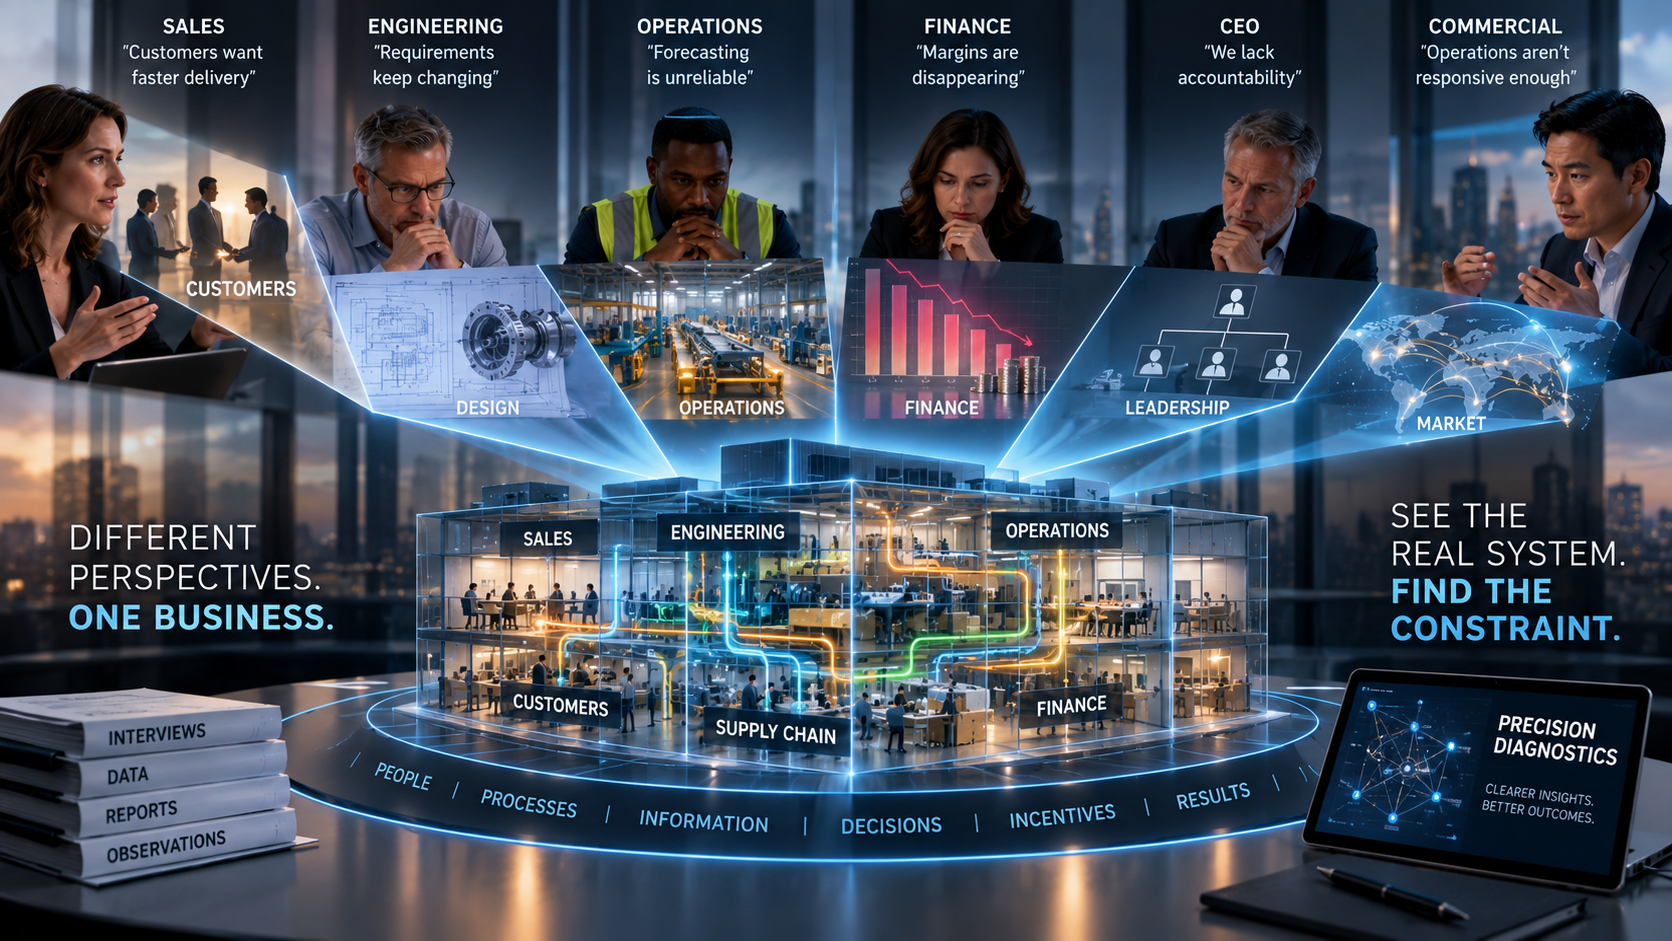
Six people. Six windows.
Imagine six people standing around a large building.
One can see the front door.
Another can see smoke coming from a window.
Another can hear an alarm.
Someone at the back can see water pouring from a pipe.
Another can see people leaving.
Ask each of them to describe the building and you’ll get completely different answers.
None of them is lying.
They’re describing the part they can see.
Businesses are like that.
People don’t experience “the system”.
They experience their part of it.
Sales experiences customers.
Operations experiences demand.
Engineering experiences requirements.
Finance experiences the numbers.
The CEO experiences all of them complaining about each other.
That’s why asking management what the problem is doesn’t necessarily produce a diagnosis.
It produces perspectives.
The diagnostic task is to reconstruct the system that could make all those perspectives simultaneously true.
This is where Precision Diagnostics is different
At Mindsheet, we always keep a human interface with the client.
People talk to people.
But behind those conversations, we use technology hard.
The objective isn’t simply to collect more information.
It’s to turn that information into a structured representation of how the business actually works.
And we do that in several layers.
First, we gather the 360-degree view
We interview the key people who see different parts of the system.
Typically, that might include people responsible for:
Sales.
Operations.
Engineering or Product.
Finance.
Supply Chain.
Service.
Strategy.
And, of course, the leadership team.
The interviews are deliberately structured, but they aren’t computer questionnaires.
We want the stories.
What works?
What doesn’t?
Where are the frustrations?
What are customers saying?
What keeps going wrong?
What have you already tried?
What do you think somebody else doesn’t understand?
And where people disagree, we don’t necessarily regard that as a problem with the interviews.
The disagreement is data.
Then we look at the evidence
People tell you what they believe is happening.
Data tells you something different.
So, where appropriate, we take existing information from the business:
ERP data.
CRM data.
Financial information.
Operational measures.
Management reports.
Strategy documents.
Standard operating procedures.
Previous studies.
Plans and forecasts.
We don’t ask the organisation to create a mountain of new information for us.
We use what already exists.
And then we start comparing the different versions of reality.
Then we describe the business as a system
This is where most of the technology disappears behind the curtain.
We don’t want hundreds of pages of interview transcripts sitting in a folder.
We convert the evidence into a structured description of the business.
We use systems thinking, including principles from the Viable System Model, to understand the essential elements of the organisation and how they interact.
What actually delivers the product or service?
How is activity coordinated?
Where does control sit?
How does management know what’s happening?
How does the organisation respond to changes outside it?
Where are decisions actually being made?
Where does information flow?
And where doesn’t it?
In other words, we stop looking at the organisation chart and start reconstructing the operating system underneath it.
Then we ask a deceptively simple question
What is this system actually trying to achieve?
That sounds obvious.
It frequently isn’t.
Growth?
Cash?
Margin?
Market share?
Delivery?
Enterprise value?
Customer retention?
Sometimes members of the same leadership team are unconsciously optimising for different things.
So we construct what we call a Goal Tree.
It describes what the system needs to achieve and the conditions required to achieve it.
Because you cannot identify a constraint until you know what the system is being constrained from doing.
Then we collect the symptoms
Perhaps:
Sales are below plan.
Margin is declining.
Projects are late.
Inventory is rising.
Customers are complaining.
Engineering changes are increasing.
Expediting costs are rising.
Staff are frustrated.
Traditional consulting can turn those into eight workstreams.
We don’t.
We assume, initially at least, that some of them may be connected.
Because symptoms aren’t necessarily problems.
They’re evidence that something else is happening.
Then we ask: what causes what?
This is where we construct the Causal Tree.
Why is margin falling?
Because we’re expediting.
Why are we expediting?
Because requirements arrive late.
Why do requirements arrive late?
Because customers keep changing them.
Why do customers keep changing them?
Perhaps they don’t.
Perhaps Sales is accepting changes because delivery dates have already slipped.
Now something interesting is happening.
What appeared to be separate problems in:
Sales,
Engineering,
Operations,
and Finance
may be different manifestations of the same underlying causal structure.
Instead of eight problems, perhaps we have three causes.
And underneath those three causes, perhaps there is one dominant constraint.
That’s the purpose of the diagnostic.
To narrow.
We saw the same principle in software
Mindsheet once worked on a project involving software integrity.
Software developers already had plenty of analysis tools.
That wasn’t the problem.
Different static analysers could generate large numbers of warnings about the same piece of software.
One tool might identify one symptom.
Another would identify something else.
A third would generate several more warnings.
The result was lots of information.
But not necessarily understanding.
So we developed a Meta-Analyser.
Its job was to sit above the individual analysis tools, correlate their findings and ask a much more useful question:
Could several of these warnings have the same underlying cause?
That is almost exactly what we’re doing with a business.
A company has thousands of warning lights.
Poor sales.
Late deliveries.
Excess inventory.
Customer complaints.
Low margins.
Staff turnover.
Quality problems.
Cash pressure.
The answer isn’t necessarily another dashboard showing all the warning lights more beautifully.
The question is:
What underlying fault could explain several of them?
And sometimes we can bring the system to life
Once you’ve formally described the system, another possibility opens up.
You can model it.
Where appropriate, we can turn parts of the business description into a dynamic model and examine how behaviour emerges over time.
What happens if demand rises?
What happens if we remove this constraint?
Does another constraint immediately become limiting?
Could the proposed intervention create an unintended consequence elsewhere?
This matters because businesses contain feedback loops.
Something that improves performance today can make performance worse six months later.
And something that appears ineffective today may be exactly the intervention that changes the system over time.
A static spreadsheet doesn’t always show that.
A system model can.
This sounds complicated
Behind the scenes, it is.
That’s rather the point.
The sophistication belongs in the diagnostic, not in the burden we place on the client.
A typical Precision Diagnostic can be completed in around two weeks.
For most members of the management team, their principal commitment is simply a structured interview.
We normally ask the client to nominate someone who can provide the existing data and documents we need.
Then we do the heavy lifting.
Interview evidence.
Documents.
Operational data.
Financial data.
System description.
Goal Tree.
Symptoms.
Causal Tree.
Alignment.
Modelling where useful.
All progressively narrowing towards one question:
What is actually constraining this business?
What’s the point?
A business isn’t an organisation chart.
It isn’t an ERP database.
It isn’t a management report.
And it isn’t the opinion of the CEO.
It’s a system made up of people, information, processes, assets, decisions, incentives and relationships.
If you diagnose those things independently, you’ll find hundreds of opportunities for improvement.
If you reconstruct how they interact, you have a chance of finding the few things that actually matter.
That’s what Precision Diagnostics is designed to do.
We don’t analyse the boxes. We reconstruct the system that connects them.
And once you can see the system, you can start to see the constraint.
If your leadership team knows the business could perform better but can’t agree exactly what’s holding it back, Mindsheet can perform a Precision Diagnostic to create a 360-degree, evidence-backed view of the system and pinpoint where intervention is most likely to make a difference.
Typically, we can complete the diagnostic in around two weeks with minimal demand on your management team.
If you’d like to discuss a Mindsheet Precision Diagnostic for your business, please contact us.